
When Signetics launched their 2650 microprocessor in 1975, a number of small computers and development boards were created for it. Central Data‘s computer appeared in the April 1977 issue of Radio Electronics, for example. All users ran into the issue of finding errors in the logic of their programs. Debugging of software on such simple machines was difficult. This pages gives an overview of how the different 2650 systems assisted the user in debugging. Sometimes surprisingly nifty hardware solutions were used.
Central Data board
 The Central Data machine is a single-board computer aimed at DIY electronics hobbyists. It contains a video display and only needs a CRT and keyboard to create a fully functional computer. Central Data assisted the user by including debug functions in their monitor program: the ability to set and clear a breakpoint, and to inspect register values and memory contents. This is all done in software; their is no specific hardware to support debugging. A breakpoint is set by inserting the hex values
 9B 91 at the breakpoint address. This will execute ZBRR *11 when the breakpoint is reached (an indirect jump to the address stored at memory location 0011). The monitor’s breakpoint service routine saves the contents of all registers, so that they can be inspected. The breakpoint is cleared so that a new one can be set, and the program can be continued using the Execute command (which will restore the register state first).
simple and cheap, but with some limitations
One disadvantage of this solution is that it is not always possible to set a breakpoint on an instruction of length one. For example, in the following program it is not possible to set a breakpoint on the EORZ,R0 instruction, because the ZBRR instruction will clobber the add instruction after it (opcodes 20 and 84).
20        init  eorz,r0
84 01     loop  addi,r0 1            ; loop with r0 in 1..8
3F xx xx        bsta,un DoSomething
E4 08           comi,r0 8
98 77           bcfr,eq loop
1b 74           bctr,un init
In short it’s a simple and cheap solution, but with some limitations.
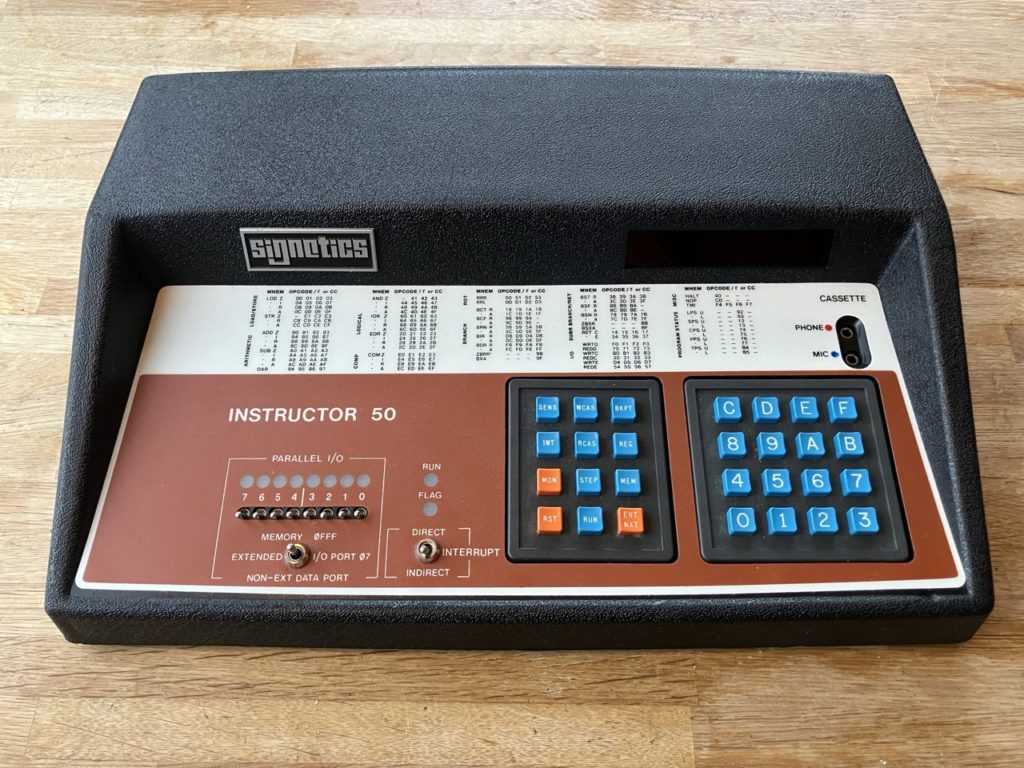
Instructor 50
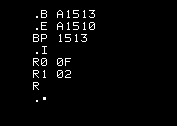
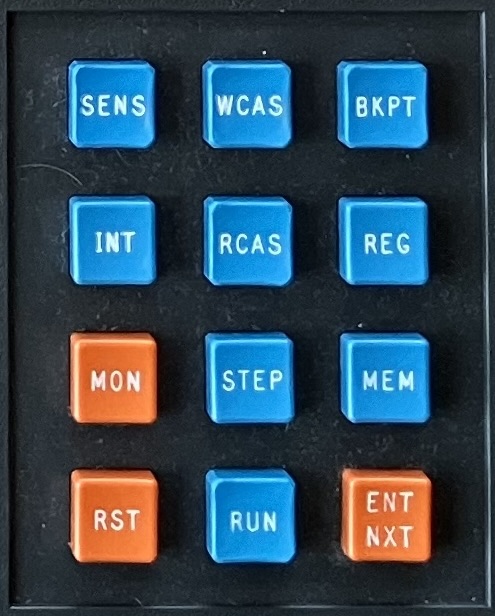
The Instructor 50 is a deceptively small system sold by Signetics for training purposes. The Instructor avoids the limitation of the Central Data machine by inserting just a single byte at the breakpoint address. The WRTC instruction (write to port C) is used for this. When the processor executes this instruction, dedicated hardware detects the write and activates the power-on procedure. The same procedure is triggered when the MON key is pressed, or when the Instructor is first switched on.
 This power-on procedure requires a nifty interplay between hardware and software. First, it causes the standard Reset signal to be raised. The 2650 stops whatever it was doing and resets the program counter to
 0000 and fetches the instruction at that address. Normally this will fetch the first address in RAM, but the debug hardware ‘intercepts’ whatever is stored at this address, and places the value C0 on the data bus (a NOP instruction). The 2650 executes this instruction, then proceeds at address 0001. Again, the debug hardware replaces whatever value is stored in memory, and puts its 1F on the data bus (an unconditional branch instruction). The next two fetches from the 2650 should retrieve the upper and lower bytes of the branch destination address, and the debug hardware provided 1800. In effect, instead of executing the program at address 0000, the debug hardware injects a branch to the monitor. That is why at startup the monitor program is started instead of the user program at address 0000.
Compared to the Central Data computer, the Instructor can thus realiably put a breakpoint on any instruction. The disadvantage is that port C cannot be used (as the WRTC instruction triggers the debug hardware) and most importantly that somewhat complicated debug hardware has to be used.
But the Instructor can do more. The power-on sequence also keeps a copy of the program counter at the moment the moment when the hardware was triggered. This Last Address Register can be read by the monitor. So when the user’s program is interrupted by pressing the MON key, you can see which instruction the user’s program was executing together with all the register-values at that moment.
clever hardware supports the Instructor’s debugging functions
And the Instructor has one more trick up its sleeve: it can single-step through the user’s program. Again this function requires additional hardware: a count-down counter under software control that will trigger the power-on procedure when it reaches zero. It counts the number of times the OPREQ signal is active. Why the OPREQ signal? Because the hardware needs to determine the exact moment when the current instruction is finished. Instructions are of variable length, some single-byte instructions take 2 cycles (such as LODZ) but other take 3 (RETC). Branch instructions that normally take take 3 cycles take 2 additional cycles when indirection is used. The 2650 does not indicate when the current instruction is finished and the next instruction can start.
The sigle-step function of the monitor solves this by inspecting the next opcode that will be executed, using the Last Address Register. The monitor then calculates the number of OPREQs that would be needed to execute that opcode. Each memory access and each I/O access raises an OPREQ. The monitor then sets the hardware count-down counter, restores all register values, and jumps to the address in the Last Address Register. The counter starts ticking and reaches zero just when the last cycle of the instruction is reached. The hardware triggers the power-on procedure, injecting an jump to the monitor onto the data bus. In this way just a single instruction is executed before control is transferred back to the monitor again.
Although outwardly the Instructor 50 appears to be a simple machine, its hardware is actually quite ingenious. Using a combination of software (the monitor) and hardware it can reset to address 0000 or to the monitor at 1800, handle breakpoints, recored and read the Last Address Register, and single-step through the user’s program. All this on a board that is approximately the same size as the Central Data board.
Signetics TWIN
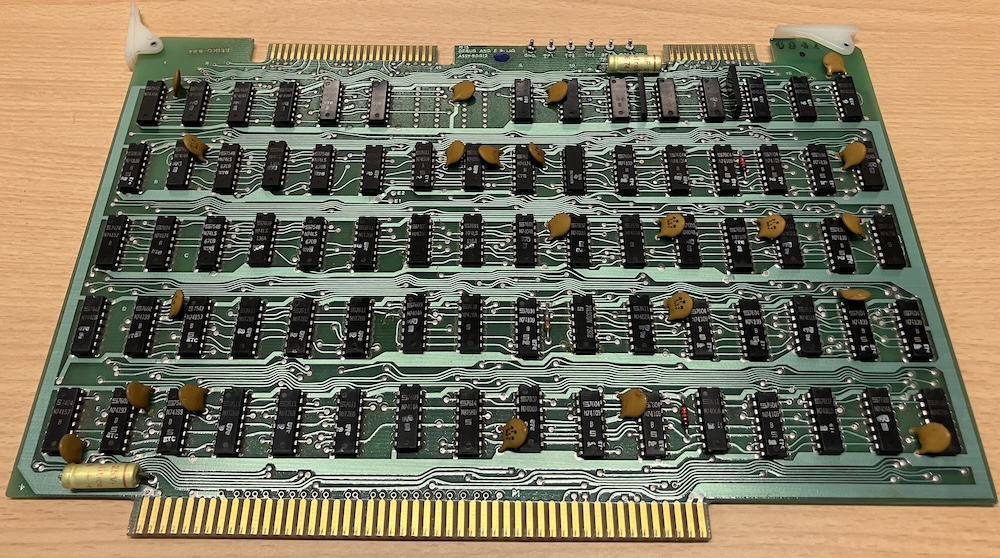
The Signetics TWIN is a large, mini-computer like machine to assist in creating and debugging other 2650-based prototypes. The TWIN contains a separate hardware module for its debugging functions. This allows for almost full control over the slave processor.
- it can set up to two independent breakpoints;
- breakpoints do not require insertion of a special instruction, but are detected entirely in hardware;
- breakpoints can be set when the address is read (as an instruction or data) or written to (for data). A breakpoint can therefore also be set on the target of an arithmetic or load/store instruction;
- force a Reset of the slave processor, or force an interrupt;
- single stepping, with inspection of register values and memory;
- stepping on branch-instructions only, with inspection of register values and memory.
the TWIN employs a trick that only Signetics itself could pull off
As the description of the Instructor 50 showed, determining the exact moment when the current instruction is finished is quite difficult. The first version of the slave module contains hardware that determines the number of OPREQs required for an instruction. On the Instructor this number was computed by the monitor program. Other hardware circuits determine whether the next instruction is a Branch instruction.
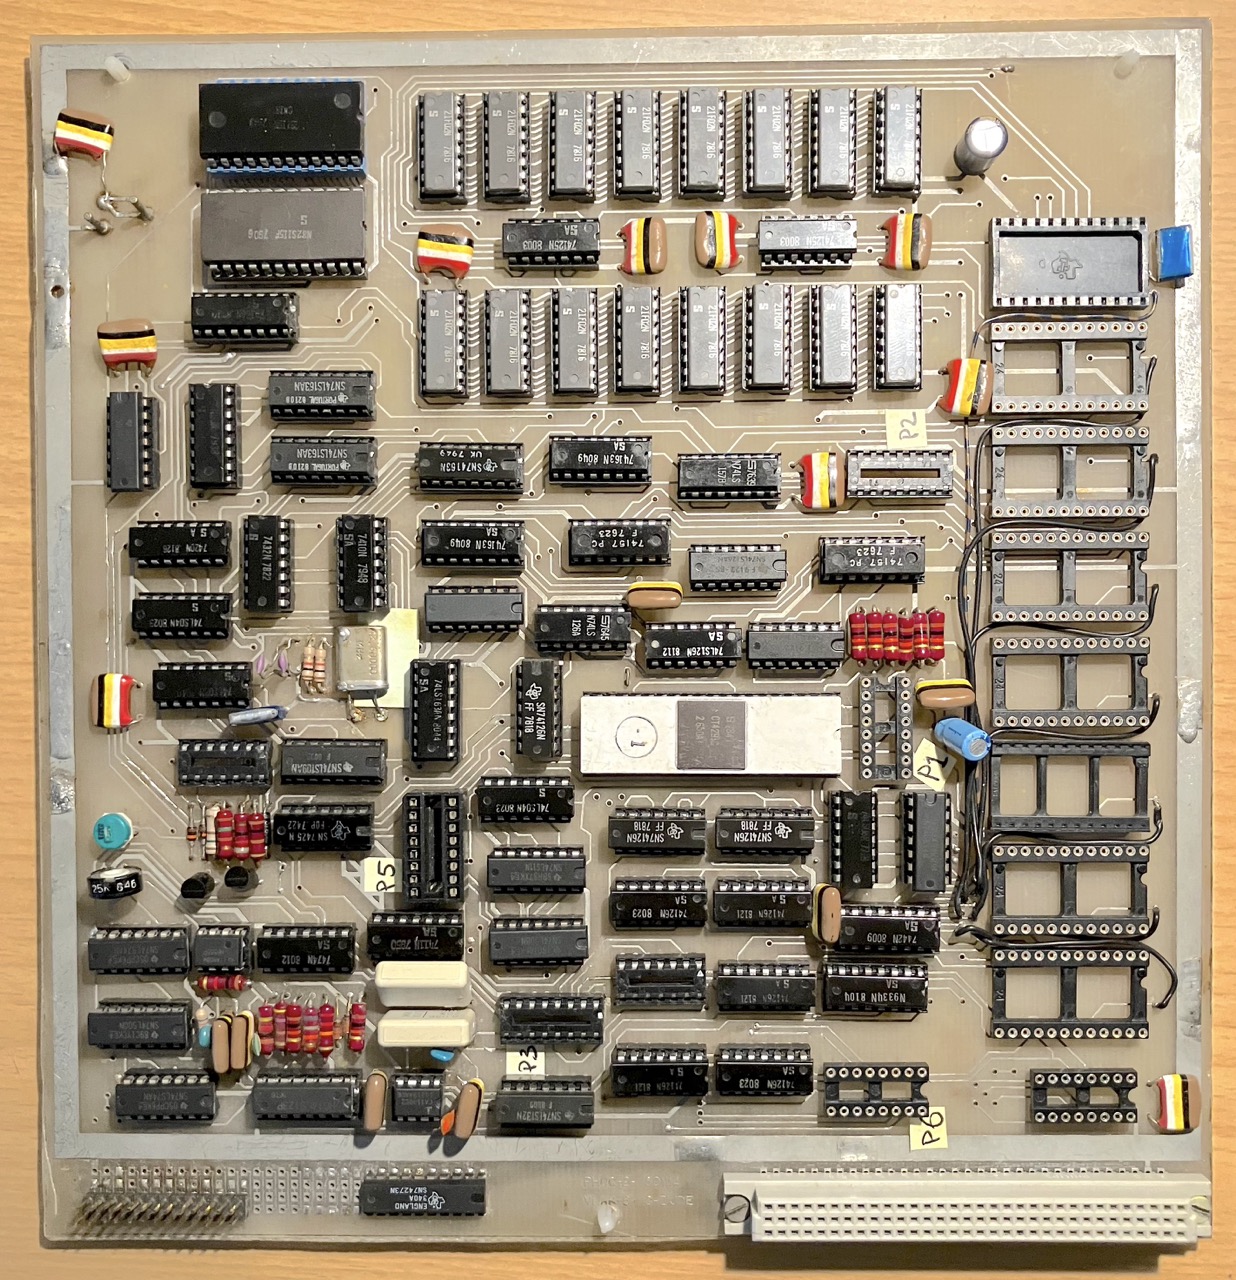
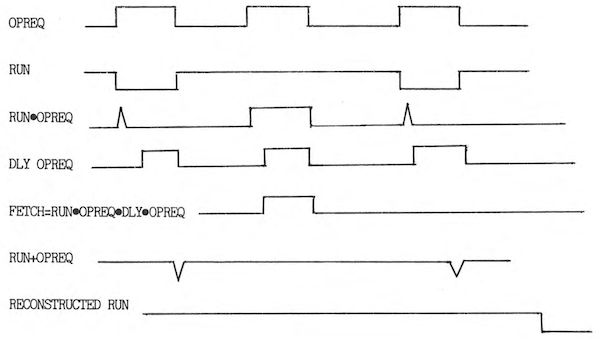 In the second version of the slave module, the TWIN employs a trick that only Signetics itself could pull off: it uses custom version of the 2650 processor (mask code CT354). This special microprocessor muliplexes a FETCH signal on the RUN/WAIT signal that otherwise continuously remains in the RUN state. The FETCH signal indicates an instruction fetch from memory. Using this custom microprocessor, the debugging hardware can be made a lot less complex.
When the 2650A microprocessor was introduced, a custom version with mask code CT904 was created.
The similarities between the debugging functions of the SIgnetics TWIN and the Instructor 50 are striking. The Instructor is less complex than the TWIN, obviously, but still a lot more involved than one would expect from “a simple trainer machine”.
The 2650B
When the 2650B was created as the successor of the 2650A, Signetics included the custom signals of the CT354/CT904 into the main design. Instead of multiplexing the signal on an existing signal, a pin on the package was freed by combining the ADREN and DBUSEN signals into one. The CYLAST signal indicates that the current instruction is on its last processor cycle, so that the next OPREQ indicates an instruction fetch. The second generation slave module for the TWIN therefore needs less special hardware.
My most surprising takeaway from this is that the Instructor 50 is a lot more sophisticated than its outward appearance would suggest.